Taming the CI Monster: How I Slashed Our Monorepo Build Times by over 66%
It started with a flood of CI pipeline failures – not because of actual bugs, but because we were hitting CI timeout limits. Our codebase housed a complex ecosystem of JVM projects and Scala.js applications powered by sbt as well as an Angular frontend powered by nx. While this polyglot architecture served our needs well, CI pipeline had become a bottleneck, turning each merge request into an extended coffee break – or more accurately, enough time to roast, grind, and brew your own coffee beans.
In this post, I’ll share how we analyzed, optimized, and ultimately reduced our GitLab CI execution time to a third of its original duration. Through a combination of strategic caching, build parallelization, and smart dependency management, we transformed our pipeline from a productivity drain into a lean, efficient system. And the best part? We did it without having to sacrifice the robust build toolkit that sbt provides, even if it occasionally thinks your laptop would make a great space heater.
Finding the Sweet Spot: Optimizing Job Granularity
One change that arguably delivered the most value and enabled further improvements was rethinking our job granularity. Getting this balance right was crucial: too many fine-grained jobs meant excessive overhead, while overly coarse-grained jobs led to inefficiencies and underutilized parallelism.
Job Overhead
Every CI job comes with unavoidable overhead - operations required to prepare the environment and execute the pipeline beyond the actual task being performed. This includes container initialization, environment setup, dependency installation, and resource allocation.
To put this in perspective: if a simple linting task takes 5 seconds to execute but requires 1 minute of container startup and environment preparation, then only about 7.7% of the pipeline time is spent on the actual task. The rest is pure overhead. That’s like spending an hour preheating the oven to cook a 5-minute microwave dinner.
Consolidating Dependent Tasks
Our publishing process involved several dependent tasks that initially had their own jobs and were executed sequentially across subsequent stages. While this structure provided clear separation, it introduced inefficiencies. Not only each job incurred overhead but also intermediate artifacts had to be passed between the jobs, adding storage and retrieval delays.
By consolidating these sequential and dependent operations into single, cohesive jobs, we eliminated redundant overhead and streamlined the workflow.
Breaking Apart Independent Tasks
While merging jobs helped cut down on overhead, some coarse-grained jobs actually benefited from being split apart.
Our testing setup was a prime example - we had placed all sbt tests into a single job, assuming this would reduce compilation overhead since many projects depended on each other. Nonetheless, we needed to parallelize.
There are two main approaches to parallelization in CI pipelines: build tool level and job level.
Build tool-level parallelization increases threads within a single job to run independent test suites simultaneously. Usually, this is already tuned. According to sbt documentation:
By default, sbt executes tasks in parallel (…) in an effort to utilize all available processors. Also by default, each test class is mapped to its own task to enable executing tests in parallel.
This means simply throwing more CPU at the problem can speed things up. However, treating resource upgrades like an all-you-can-eat buffet isn’t sustainable. Sometimes test parallelization is limited or outright disabled due to shared resources, making this approach less effective.
Job level parallelization – splitting monolithic jobs into multiple smaller ones that run concurrently - became our primary strategy.
Smart Job Splitting
How to split the job isn’t straightforward. A good starting point is to make the jobs as equal as possible in duration.
Importantly, this doesn’t necessarily mean creating one job per module. Some of our test suites took longer to execute than testing an entire different module! We had to look beyond simple module boundaries to achieve balanced execution.
For sbt users, the sbt-test-shards plugin may assist in that. It offers both basic suite name distribution and sophisticated balancing algorithms that consider historical test execution times.
However, there are more things to keep in mind when splitting tests. With finer-grained jobs comes the ability to be selective.
Most CI/CD tools support diff-based job rules. Instead of running all tests on every commit, we configured our pipeline to launch only affected modules and their dependents.
 Modules at the bottom of the dependency graph naturally run more frequently, so it’s worthwhile to pay special attention to their scheduling and optimization.
It is also a good time reviewing project dependencies to ensure they are necessary. If certain projects are frequently rebuilt due to dependencies, consider refactoring to reduce cascading builds. This dependency pruning has benefits beyond CI optimization.
Modules at the bottom of the dependency graph naturally run more frequently, so it’s worthwhile to pay special attention to their scheduling and optimization.
It is also a good time reviewing project dependencies to ensure they are necessary. If certain projects are frequently rebuilt due to dependencies, consider refactoring to reduce cascading builds. This dependency pruning has benefits beyond CI optimization.
Selective execution approach can be combined with build tool-level optimizations. For example:
- nx provides the
affectedcommand for comparing changes using version control - sbt offers the
testQuicktask for similar functionality (though it is more tricky in CI settings)
This approach extends beyond tests. It’s crucial to consider overall computing time, not just pipeline duration. It may sound like a cliché, but apparently it is not. There’s no need to build and deploy a new version for changes unrelated to the build, like documentation updates or tweaking CI configurations. Nobody wants to waste compute power on a README edit, right?
Anyway, after distributing tests, the initial premise kicks in: now we find a lot of duplicated work, as we are compiling the same modules multiple times across jobs. This is where effective caching strategies became crucial, which I’ll explain in the next section.
Caching: Teaching Your CI Pipeline to Remember
If pipeline optimization were a game, caching would be the power-up that lets you skip levels. It can significantly reduce your pipeline duration by eliminating repetitive work that doesn’t change between runs.
The Low-Hanging Fruit
The most common use case—and easiest win—is caching your project dependencies. Anyone who’s stared blankly at a terminal while watching sbt resolve transitive dependencies (again) or waited for npm to download the entire JavaScript ecosystem into node_modules knows this pain intimately.

While many teams implement basic dependency caching, fewer pay attention to how that cache gets updated. For instance, GitLab’s default cache policy is pull-push, which updates the cache after every successful job. This sounds reasonable until you realize it’s creating unnecessary work.
Our approach was more selective:
cache:
  key:
    files:
      - build.sbt
      - project/Dependencies.scala
  paths:
    - .ivy2/cache
    - .sbt
  policy: pull
We maintain separate cache keys for sbt and npm dependencies, and only update them in separate jobs on protected branches (like main) and only when dependency files have actually changed.
Beyond dependencies
Caching in CI is not limited to dependencies—it applies to anything that remains unchanged between builds. This is where caching mechanisms in our build tools can truly shine.
sbt has a sophisticated caching mechanism built into its core, which has been progressively refined over the years. A major improvement arrived in sbt 1.4.x with the introduction of repeatable builds. It enables build outputs from one machine to be reused by another, provided that the inputs remain identical. The mechanism relies on content hashes for change detection, ensuring that only modified files trigger rebuilds.
This makes it possible to cache the target directory and potentially reuse it across builds. However, sbt offers a more refined approach through built-in keys designed for this purpose:
pushRemoteCacheTopushRemoteCachepullRemoteCache
Setting up remote caching in sbt is surprisingly straightforward:
ThisBuild / pushRemoteCacheTo := Some("Your repo" at "http://your.repo.com")
ThisBuild / credentials += Credentials("Your repo", "http://your.repo.com", "user", "topsecret-pass")
In this example, we use a Maven repository, but you can integrate with various backends including S3, Nexus OSS, Minio, or even Jenkins artifacts if you prefer.
Once configured, you can update the cache using pushRemoteCache and retrieve it with pullRemoteCache, whether from a CI worker or your local machine (great for when your laptop is already working overtime heating your room).
That said, don’t be surprised if you encounter cache misses even when no changes seem apparent. sbt’s remote caching is still considered an ✨experimental✨ feature and has some quirks and limitations. For a deeper dive, I highly recommend the excellent article by Sébastien Boulet.
Despite its experimental nature, sbt’s remote caching nearly eliminated our compilation overhead. This was particularly impactful for jobs at the bottom of the dependency graph, which run most frequently and previously suffered the highest compilation costs.
Similarly, nx provides intelligent caching for JavaScript and TypeScript-based monorepos. It caches the results of tasks like builds and tests, ensuring that if the same task is rerun without changes to its dependencies, the cached output is used instead of re-executing the task. Nx caching stores both the terminal output and generated files (such as built artifacts in the dist directory).
The officially recommended remote caching solution is Nx Cloud, a paid service. Previously, teams could implement custom remote caches using task runners, but with Nx v20, custom runners have been deprecated (cue dramatic groans from the community). The new replacement, Powerpack, is still a hot topic of debate[1][2].
However, even without Nx Cloud, you can still roll your own remote caching solution at the CI tool level. One practical approach is caching the local .nx/cache directory across CI workers. A typical strategy includes:
- Maintaining separate cache keys for each protected branch.
- Updating the cache only when relevant changes occur.
- Using fallback cache keys for custom branches.
The final piece of our caching strategy involves static documentation sites. Unlike other build artifacts, documentation builds are tightly coupled with project builds, making separate jobs and selective execution challenging.
We use mkdocs for building them – it has a great community and rich plugin ecosystem, but I couldn’t find anything specifically designed for caching builds.
The official way to reuse builds is to use the --dirty option, but it’s “dirty” in more ways than one – it can leave broken links and incomplete pages. So, faced with yet another optimization challenge, I decided to build my own solution.
Enter mkdocs-build-cache-plugin, my contribution to the ecosystem. It works very similar to tools mentioned above in that it computes a unique hash based on your source files, configuration, and any additional tracked files. If nothing has changed since the last build and the output directory already contains valid content, the plugin can abort the build early, saving valuable time.
To use in CI settings, you should cache the site directory and the build-cache.json file from your docs directory across the workers.
In our case, this resulted in another 2-3 minutes saved on cache hits – not bad for a weekend project that started with the thought, “How hard could it be to write a caching plugin?”
The Results
So what are the actual results after all these tweaks? Well, there is a spoiler in the title…
The improvements came in distinct phases. Let’s look at the data to see exactly how these changes transformed our CI process. I added smoothed duration with a moving average (window size of 10), providing a clearer trend over time.
Looking at the publishing duration graph, we can see two distinct drops in execution time:
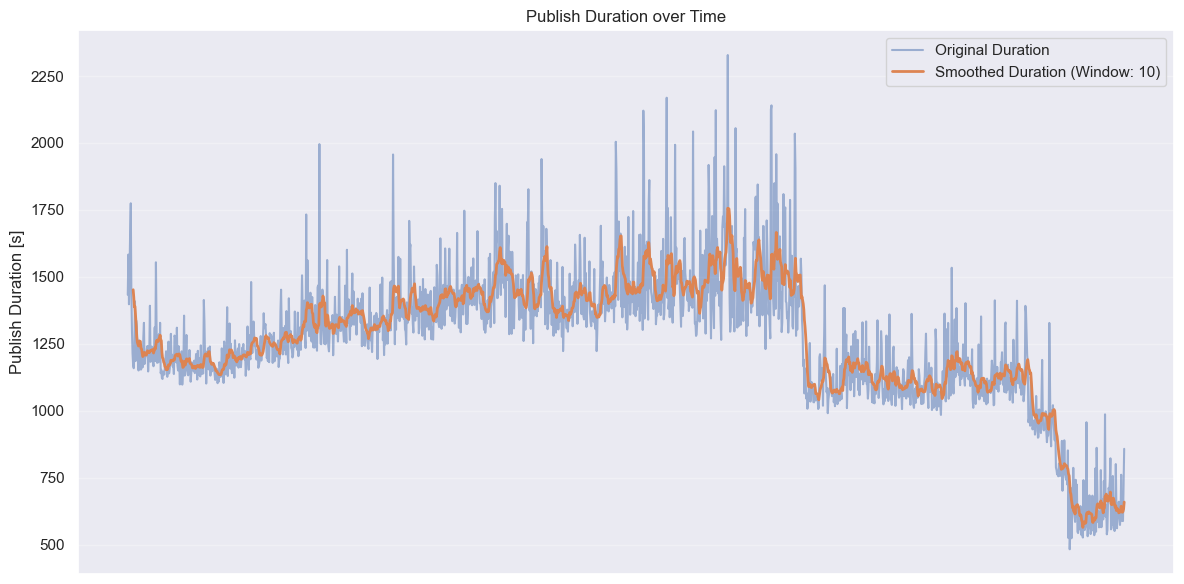
When we consolidated dependent tasks and optimized job granularity, our publish times dropped from an average of ~1500 seconds to around 1200 seconds - a 20% improvement with relatively simple changes. However, the real game-changer was leveraging caching effectively. Introducing remote build caching cut times even further to approximately 600 seconds.
Test execution times show an even more impressive transformation
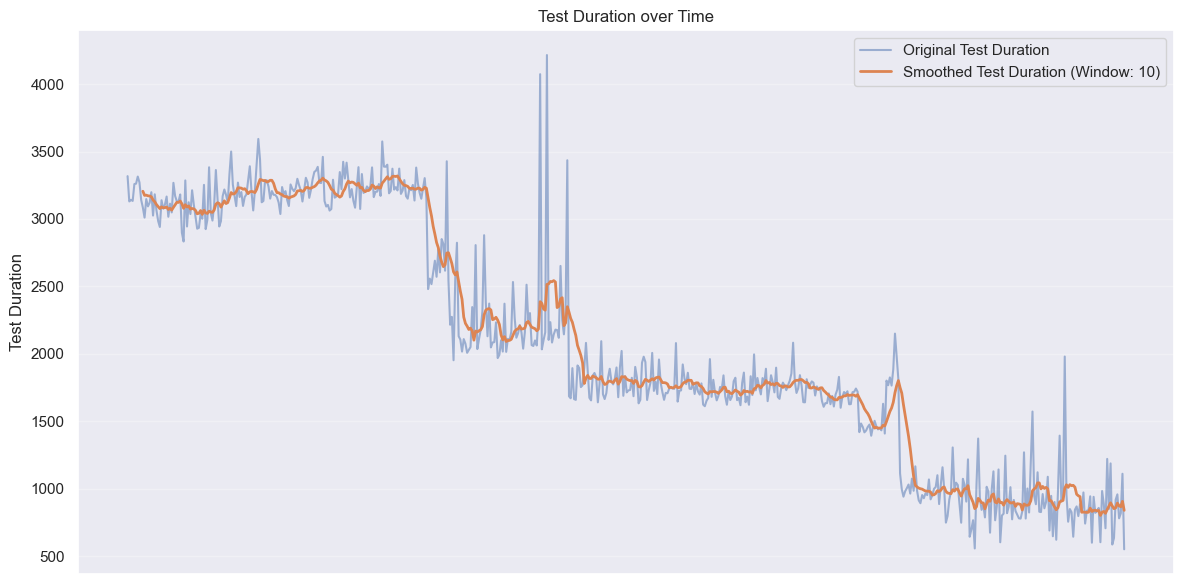
Our first caching efforts brought average test durations down from about 3200 seconds to around 2200 seconds. After tweaking our caching strategy to be more selective about cache updates and optimizing dependencies, we saw another drop to roughly 1700 seconds. The final dramatic improvement came from intelligently splitting our test jobs and implementing selective execution. This brought our average test duration down to approximately 900 seconds - less than a third of our starting point.
One potential downside of pipeline parallelization is that while it speeds up execution, it may increase the overall compute time, leading to higher costs. However, in our case, not only did the pipeline duration decrease, but the total compute time also dropped.
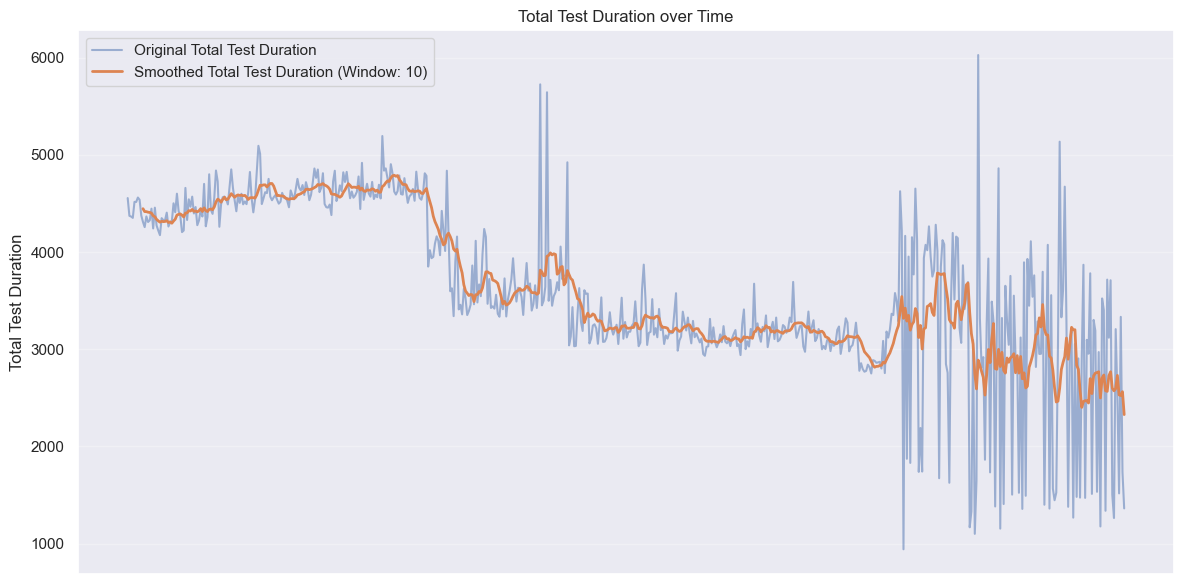
The overall computing time decreased from peaks of around 4700 seconds to averages hovering around 2700 seconds - a 43% reduction in total resource consumption. By being smarter about when and what we were testing, we cut down unnecessary runs and made sure we weren’t wasting precious CI cycles. In short, faster and cheaper—the rare combo we all dream of.
Takeaways
We slashed our CI build times by over 66%, saving everyone from endless loading screens and existential crises while waiting for pipelines to finish. The approach we took wasn’t about choosing the fanciest new tools or purchasing more compute power—it was about finding the right balance between parallel execution, intelligent caching, and selective processing.
Here are the key takeaways from our optimization journey:
Start with data
Before making changes, collect comprehensive baseline metrics. Understand which jobs take the longest, where time is being spent within those jobs, and which parts of your codebase trigger the most frequent rebuilds.
Balance is key
More parallel jobs don’t always mean faster builds. Consolidate dependent tasks while breaking apart independent but find the sweet spot where you’re maximizing parallelism without creating resource contention or excessive overhead.
Cache strategically
Move beyond basic dependency caching to leverage build tool caching mechanisms and create custom solutions when needed. Well-designed caching can often provide more significant speedups than code optimizations.
Think beyond individual jobs
Think about the entire pipeline structure, not just individual jobs.
- Consider the overall workflow and be selective, running only what’s necessary based on actual code changes;
- Focus your efforts on the most frequent execution paths. It’s better to optimize the daily developer workflow than spending weeks shaving minutes off a monthly release process.
While your specific tech stack might differ, I believe the principles are universal. By examining your own CI pipeline with an eye toward overhead reduction, strategic caching, and smart parallelization, you can achieve similar or even better results regardless of your technology stack. Start with data, optimize strategically, and continuously measure your progress. Your future self (and your team) will thank you when that first cup of coffee is still hot when the build completes :)
Happy optimizing! 🚀